Track your own DORA + Code metrics with GitHub Actions → Recorder
As more development is handed to AI agents or offshore teams, it's easy to end up with code that runs without ever passing review — leaving the real state and complexity of the codebase hard to see. This recipe accumulates DORA and code metrics so you can keep a bird's-eye view of development done by others.
What you get out of this
More and more development is being handed to AI agents these days. It's convenient, but without care you end up with code that runs even though it never went through review — which leaves the real state and complexity of the codebase hard to see. With agent-driven or offshore work — development by hands other than your own — that blind spot is even wider.
Accumulating DORA and code metrics from GitHub Actions into the Recorder gives you a time-series, bird's-eye view of development done by others. It's also a good way to get a feel for the Recorder API end-to-end. You'll be recording these four:
<MyApp>/DORA/Deploy— daily deploy count (daily cron)<MyApp>/DORA/LeadTime— PR open → merge duration (per merge)<MyApp>/Code/Lines— total LOC at HEAD (per merge)<MyApp>/Code/PushDelta— net lines added/removed per merge
Pick any prefix for <MyApp> (e.g. MyTeam/..., Frontend/...). Each becomes its own tag in the Recorder, so the prefix is your namespace if you later want to compare multiple apps or teams side by side.
Note: The Deploy count and LeadTime recorded here map to two of DORA's (DevOps Research and Assessment) Four Keys. For the formal definition and measurement guidance behind each metric, see the original DORA guide. DORA defines three other metrics (Change Failure Rate / Failed Deployment Recovery Time / Deployment Rework Rate), but each one needs information about when a deployment failed or an incident occurred — which GitHub Actions alone can't supply — so they are out of scope for this recipe.
Prerequisites
- A Recorder account
- A GitHub repo where you can drop in workflow files
Setup
1. Mint a Recorder PAT
Go to Settings → API Tokens and create a PAT. The token string is only shown once in the issuance dialog — copy it immediately.
2. Register it as a GitHub Secret
In your repo's Settings → Secrets and variables → Actions, add a secret named RECORDER_PAT and paste the token from step 1.
# Or via gh CLI
gh secret set RECORDER_PAT --repo your-org/your-repo
3. Drop in the workflows
.github/workflows/post-on-deploy.yml (runs on each merge):
name: Post DORA metrics on deploy

on:
  push:
    branches: [main]

permissions:
  contents: read
  pull-requests: read

jobs:
  post:
    runs-on: ubuntu-latest
    steps:
      - uses: actions/checkout@v5
        with:
          fetch-depth: 0

      - name: Compute and post LeadTime + Lines
        env:
          RECORDER_PAT: ${{ secrets.RECORDER_PAT }}
          APP_PREFIX: MyApp  # pick your own prefix
          GH_TOKEN: ${{ secrets.GITHUB_TOKEN }}
        run: |
          # PR open → merge duration (minutes)
          PR_NUM=$(gh pr list --state merged --base main --limit 1 --json number --jq '.[0].number')
          if [ -n "$PR_NUM" ]; then
            OPENED=$(gh pr view "$PR_NUM" --json createdAt --jq '.createdAt')
            MERGED=$(gh pr view "$PR_NUM" --json mergedAt --jq '.mergedAt')
            LEAD_MIN=$(( ($(date -d "$MERGED" +%s) - $(date -d "$OPENED" +%s)) / 60 ))
            curl -sS -X POST https://api.recorder.nasebanal.com/api/v1/records \
              -H "Authorization: Bearer $RECORDER_PAT" \
              -H "Content-Type: application/json" \
              -d "{\"name\":\"$APP_PREFIX/DORA/LeadTime\",\"unit\":\"min\",\"data_type\":\"integer\",\"chart_type\":\"line\",\"value\":$LEAD_MIN}"
          fi

          # Total LOC at HEAD
          LINES=$(git ls-files | xargs wc -l 2>/dev/null | tail -1 | awk '{print $1}')
          curl -sS -X POST https://api.recorder.nasebanal.com/api/v1/records \
            -H "Authorization: Bearer $RECORDER_PAT" \
            -H "Content-Type: application/json" \
            -d "{\"name\":\"$APP_PREFIX/Code/Lines\",\"unit\":\"lines\",\"data_type\":\"integer\",\"chart_type\":\"line\",\"value\":$LINES}"
.github/workflows/post-daily.yml (one daily cron):
name: Post deploy count daily

on:
  schedule:
    - cron: '5 0 * * *'  # 00:05 UTC every day
  workflow_dispatch:

jobs:
  post:
    runs-on: ubuntu-latest
    steps:
      - name: Count yesterday's deploys
        env:
          RECORDER_PAT: ${{ secrets.RECORDER_PAT }}
          APP_PREFIX: MyApp
          GH_TOKEN: ${{ secrets.GITHUB_TOKEN }}
        run: |
          SINCE=$(date -u -d 'yesterday 00:00' +%Y-%m-%dT%H:%M:%SZ)
          UNTIL=$(date -u -d 'today 00:00' +%Y-%m-%dT%H:%M:%SZ)
          COUNT=$(gh run list --workflow deploy.yml --created "$SINCE..$UNTIL" --json status --jq 'map(select(.status=="completed")) | length')
          curl -sS -X POST https://api.recorder.nasebanal.com/api/v1/records \
            -H "Authorization: Bearer $RECORDER_PAT" \
            -H "Content-Type: application/json" \
            -d "{\"name\":\"$APP_PREFIX/DORA/Deploy\",\"unit\":\"count\",\"data_type\":\"integer\",\"chart_type\":\"bar\",\"value\":$COUNT}"
4. Smoke test
Before relying on a merge, POST a single record by hand to confirm the token is wired up.
export RECORDER_PAT="the token you copied in step 1"

curl -sS -X POST https://api.recorder.nasebanal.com/api/v1/records \
  -H "Authorization: Bearer $RECORDER_PAT" \
  -H "Content-Type: application/json" \
  -d '{"name":"MyApp/DORA/Deploy","unit":"count","data_type":"integer","chart_type":"bar","value":1,"comment":"smoke test"}'
MyApp/DORA/Deploy should now appear in your Recorder tag list. Merge a PR and post-on-deploy.yml will start filling in the real metrics.
Sample output
After a week or two of data, the Recorder lets you line your metrics up as a time series. Below is NASEBANAL's own nb-recorder repo, so the tag prefix is System/... — yours would line up under your own <MyApp>/... prefix.
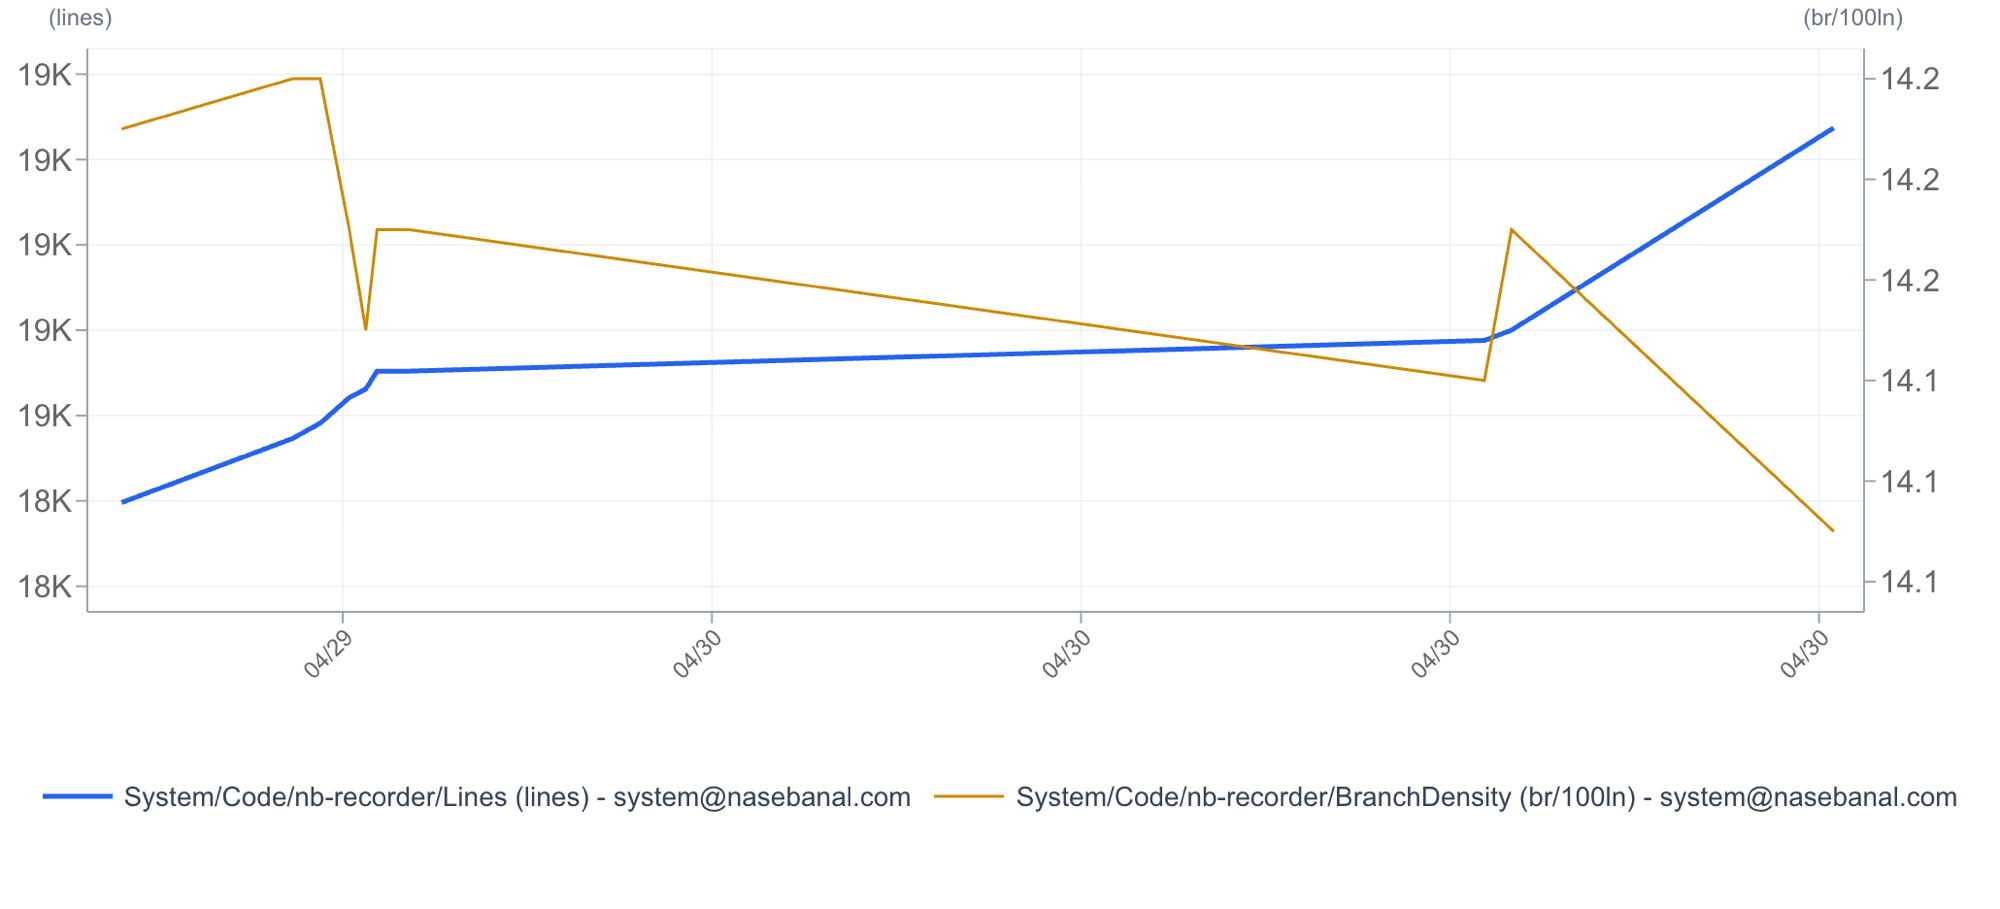
Left axis is Code/Lines (orange), right axis is Code/BranchDensity (green). LOC trending up while branch density edges down reads as "the codebase is growing, but the average density of if branches is thinning" — i.e. structural refactoring is keeping pace with growth.
⚠️ Secret handling
- The PAT string is shown only once in the issuance dialog and cannot be re-displayed
- Use the PAT only via GitHub Secrets — don't write it to a local file
- If you suspect a leak, revoke the PAT in Recorder Settings → API Tokens, mint a new one, and overwrite the GitHub Secret