Track Claude Code token consumption per project with the Recorder (Stop hook)
When you develop with a personal agent subscription, it's surprisingly hard to see how many tokens each piece of work actually burns. This recipe shows how to make per-project Claude Code token consumption visible in the Recorder via a Stop hook.
What you get out of this
When you develop with a personal agent subscription, it's surprisingly hard to tell how many tokens each piece of work actually burns. Claude Code's session transcript only lives locally, and even the Anthropic Console only shows an API-key-level total.
This recipe uses a Claude Code Stop hook to accumulate per-project (per launch directory) token consumption in the Recorder so you can see it. Each session records these four values under a <MyPrefix> you choose:
<MyPrefix>/Input— input tokens (raw prompt)<MyPrefix>/Output— output tokens<MyPrefix>/CacheRead— tokens served from the prompt cache<MyPrefix>/CacheCreate— tokens written to the prompt cache
Name one <MyPrefix> per Claude Code launch directory. Aligning it with System/Code/<app>/Claude/Tokens puts your token spend in the same tree as the Lines and Deploy series from the DORA recipe, so you can overlay "LOC growth vs token spend" or "deploy count vs token spend" in one chart — slices the Anthropic Console (API-key-scoped Usage) can't give you.
Note: The four values (
Input/Output/CacheRead/CacheCreate) are copied straight from theusageobject of the Claude API response (input_tokens/output_tokens/cache_read_input_tokens/cache_creation_input_tokens). For the precise definition of each field — in particular thatinput_tokenscounts only the uncached input after the last cache breakpoint — see the original Anthropic prompt caching docs. That definition is whyInputreads so low in the sample output.
Prerequisites
- Claude Code installed locally
- A Recorder account
jq(for aggregating the JSONL)
Why a hook, not a cron
Claude Code session transcripts live only on your machine — ~/.claude/projects/<encoded-cwd>/<session-id>.jsonl. Each line carries message.usage = {input_tokens, output_tokens, cache_creation_input_tokens, cache_read_input_tokens} with a timestamp. A GitHub Actions cron can't reach this data; running locally at session-end is the natural fit.
Setup
1. Mint a Recorder PAT
In Settings → API Tokens, create a PAT, copy the string immediately (shown only once), and export RECORDER_PAT="..." from your ~/.zshrc or equivalent.
2. Check the directory you want to track
Claude Code names project dirs by / → --encoding your launch cwd. Launch Claude Code once from the dir you want to track, then ls the projects directory and copy the matching basename:
ls ~/.claude/projects/
# e.g. -Users-me-code-myapps   ← copy this line
3. Drop in the Stop hook script with your dir and metric prefix
Save as ~/bin/post_claude_tokens.sh. Only the two lines in the case arm need to change — leave the rest alone.
#!/usr/bin/env bash
set -euo pipefail

: "${RECORDER_PAT:?env RECORDER_PAT is not set}"

PAYLOAD=$(cat)
# PAYLOAD may carry unescaped control chars (e.g. in last_assistant_message),
# so it isn't strict JSON — extract just the path (a filesystem path has no ")
TRANSCRIPT=$(printf '%s' "$PAYLOAD" | grep -o '"transcript_path":"[^"]*"' | head -1 | sed 's/.*:"//; s/"$//')
PROJECT_BASENAME=$(basename "$(dirname "$TRANSCRIPT")")

# ─── ⬇ Edit these two lines for your setup ⬇ ───
case "$PROJECT_BASENAME" in
  -Users-me-code-myapps)                                # ← the basename from step 2
    METRIC_PREFIX="System/Code/myapps/Claude/Tokens" ;; # ← the prefix you want in Recorder
  *)
    exit 0 ;;
esac
# ─── ⬆ end of edits ⬆ ───

read -r INPUT OUTPUT CREAD CCREATE <<<"$(jq -R -s -r '
  [ split("\n")[]
    | select(length > 0)
    | (fromjson? // empty)            # skip rows Claude Code wrote with unescaped control chars
    | .message.usage // empty
  ]
  | reduce .[] as $u (
      {input:0, output:0, cread:0, ccreate:0};
      .input    += ($u.input_tokens // 0)
      | .output   += ($u.output_tokens // 0)
      | .cread    += ($u.cache_read_input_tokens // 0)
      | .ccreate  += ($u.cache_creation_input_tokens // 0)
    )
  | "\(.input) \(.output) \(.cread) \(.ccreate)"
' "$TRANSCRIPT")"

post() {
  local name=$1 value=$2
  curl -sS -X POST https://api.recorder.nasebanal.com/api/v1/records \
    -H "Authorization: Bearer $RECORDER_PAT" \
    -H "Content-Type: application/json" \
    -d "{\"name\":\"$name\",\"unit\":\"tokens\",\"data_type\":\"integer\",\"chart_type\":\"line\",\"value\":$value}"
}

post "$METRIC_PREFIX/Input"       "$INPUT"
post "$METRIC_PREFIX/Output"      "$OUTPUT"
post "$METRIC_PREFIX/CacheRead"   "$CREAD"
post "$METRIC_PREFIX/CacheCreate" "$CCREATE"
Make it executable:
chmod +x ~/bin/post_claude_tokens.shTo track more than one directory, add another arm to the case block.
4. Register the Stop hook in Claude Code settings
~/.claude/settings.json:
{
  "hooks": {
    "Stop": [
      {
        "matcher": "",
        "hooks": [
          {
            "type": "command",
            "command": "bash ~/bin/post_claude_tokens.sh"
          }
        ]
      }
    ]
  }
}
5. Smoke test
Open one short Claude Code session from the dir you noted in step 2 and end it cleanly. The Recorder tag list will show <MyPrefix>/{Input,Output,CacheRead,CacheCreate} — one data point per session, four tags growing in parallel from there.
Sample output
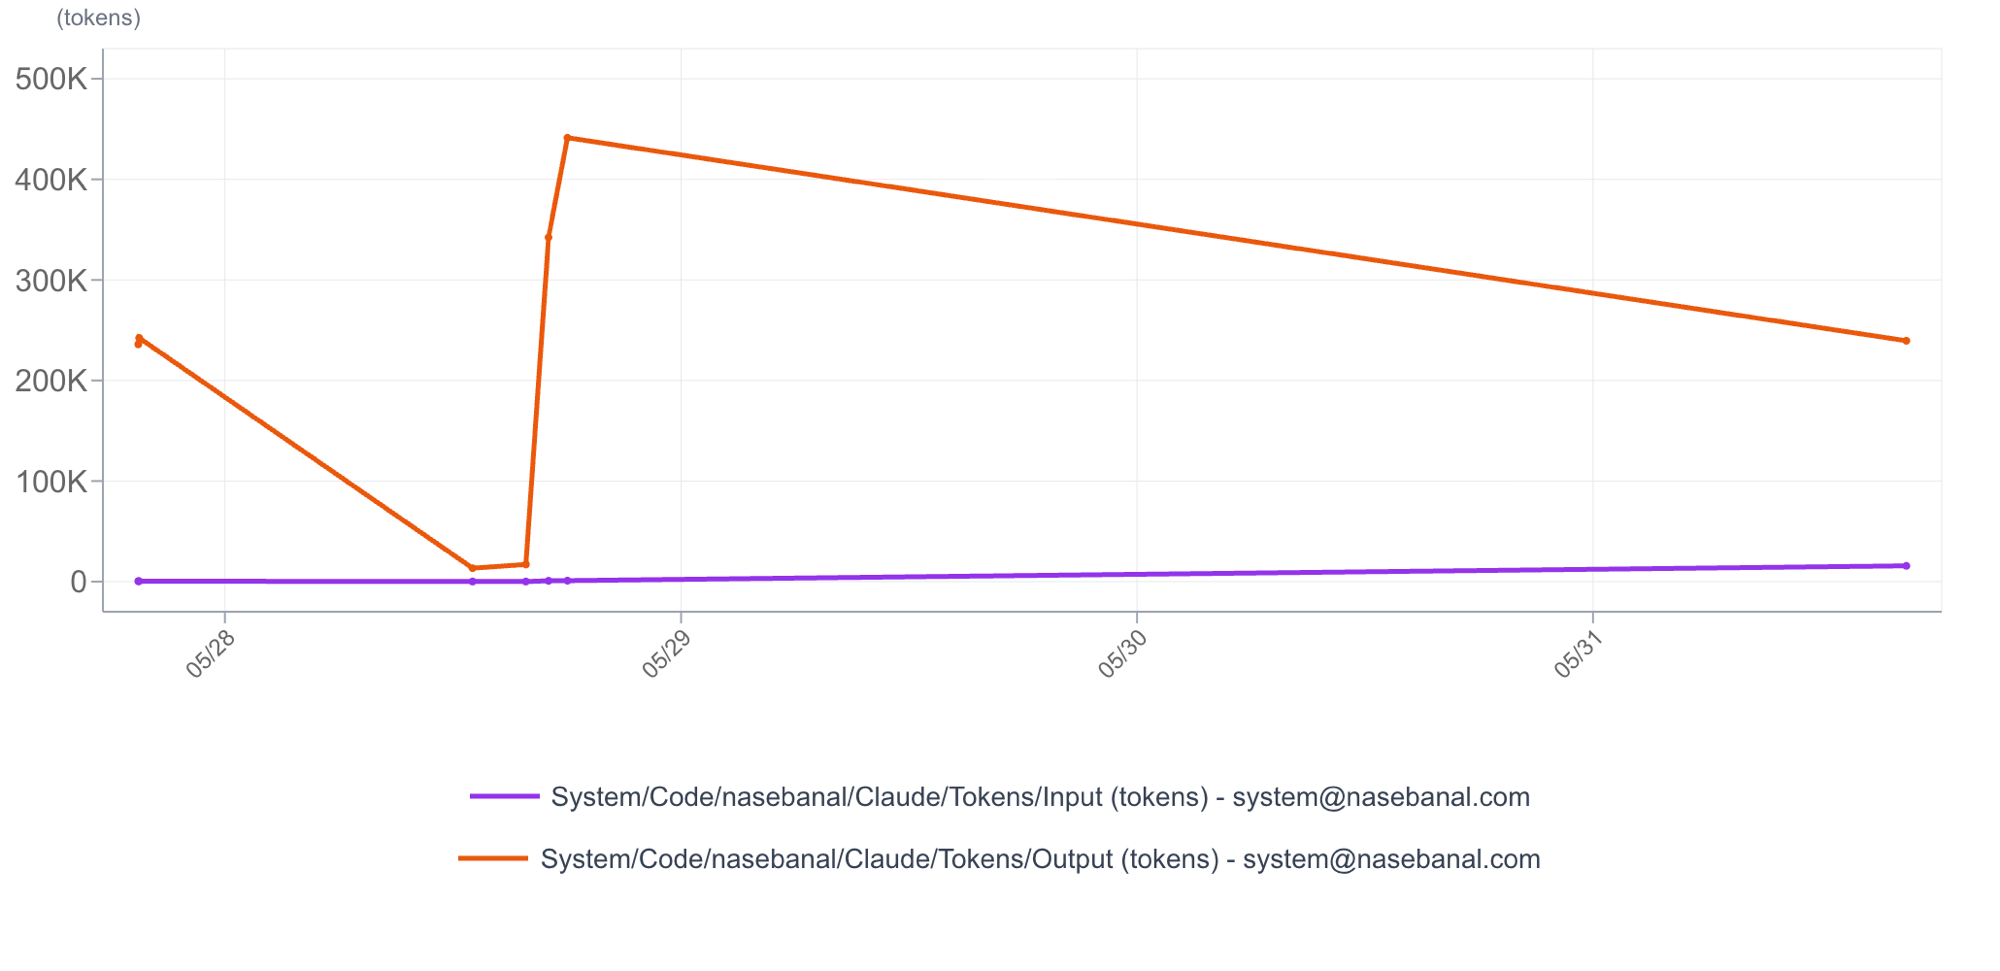
After a handful of sessions, the four token types line up under one tree in the Recorder. The real System/Code/nasebanal/Claude/Tokens data is easiest to read split across two very different scales.
First the raw Input / Output (tokens that don't go through the cache). Output (green) climbs into the hundreds of thousands while Input (red) hugs the baseline — most of the input is served from the prompt cache, so the raw input token count actually lands below output.
Then the cache side. CacheRead (green) reaches tens of millions of tokens while CacheCreate (red) stays comparatively small. The scale is roughly 100× the I/O chart, which is why it's a separate plot. The takeaway: almost all of the context is reused from the prompt cache, keeping the actually-billed raw input small.
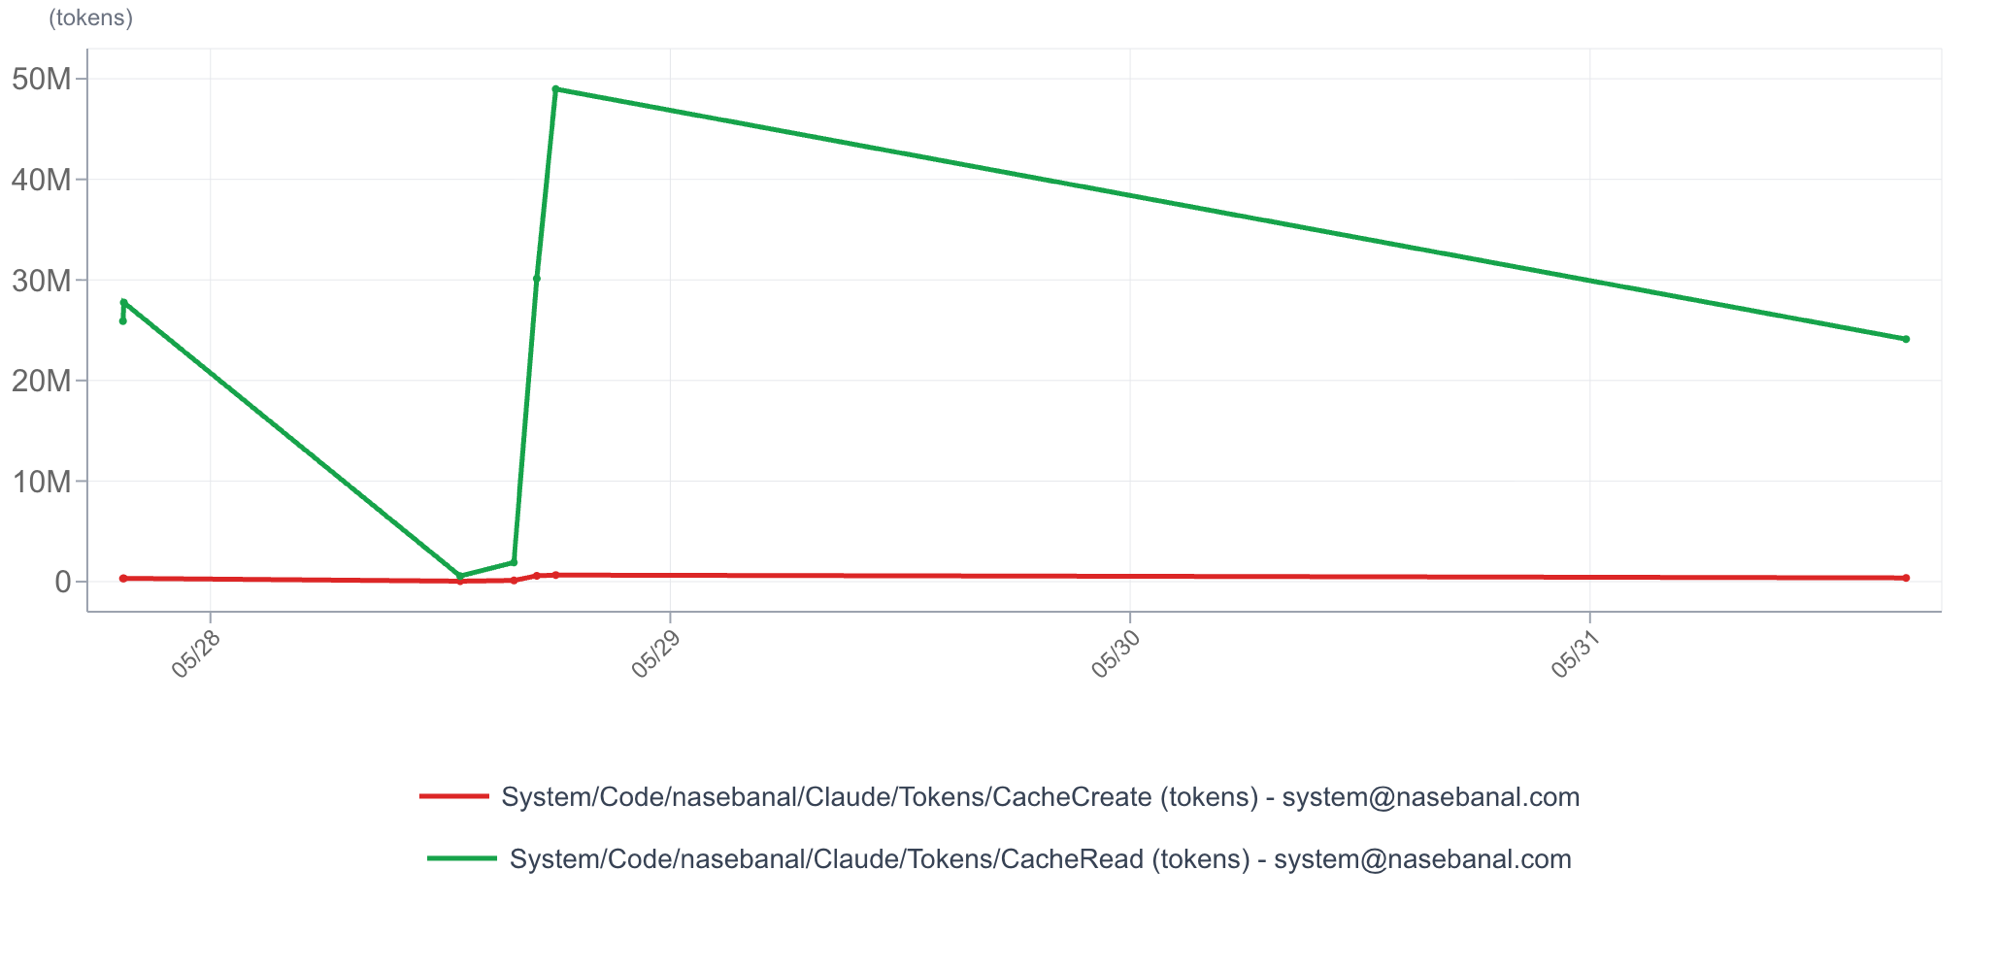
This is a per-dir / per-app breakdown you can't get from the API-key-level Usage in the Anthropic Console.
⚠️ Secret handling
- Keep
RECORDER_PATin~/.zshrcor your secret manager — never hardcode it in the script - If you suspect a leak, revoke the PAT in Recorder Settings → API Tokens, mint a new one, and overwrite the environment variable
- The Stop hook fires for every Claude Code session. Projects not listed in the
casemap are silently dropped by the*) exit 0arm, so untracked work never bleeds into the Recorder